User Guide
This Bob package allows you to use the menpofit package to train and search for fingers in near-infrared (NIR) fingervein imagery. It includes a pre-trained model that can be used off-the-shelf, but also allows you to create your own model after annotating your own database.
Database organization
In order to use this package, you’ll need to organize a database of files and annotations corresponding to the data you’ll use for training and evaluating models generated by this package. There is no particular directory structure required, for as long there is a matching set of images and annotations in separate directories, following the same organization structure. For example, this could be:
+ database
  + image1.png
  + image2.png
+ annotations
  + image1.txt
  + image2.txt
Then, you would pass <path-to>/database and <path-to>/annotations as
inputs to the various scripts in this package. Each finger should be annotated
using exactly 8 points in y x format with y and x being integers
indicating the point coordinates starting from the top left of the image
(coordinates 0 0). The 8 points should be set in the annotation file in
this specific order:
- left metacarpophalangeal (MCP) joint - the joint at the base of the finger
- left proximal interphalangeal (PIP) joint - the joint in the middle of the finger
- left distal interphalangeal (DIP) joint - the joint closest to the finger tip
- top left visible point of the finger, closest to its tip
- top right visible point of the finger
- right DIP
- right PIP
- right MCP
Tip
The package bob.ip.annotator can help you annotating fingers and saves
results in the right format.
Checking your database
The program checkdb.py can help you check if all available annotations in a
given directory are consistent. This means:
- They contain 8 points
- Each annotation is within bounds of the respective image in the original database
- The point order is consistent with their expected position. For example, that the left MCP point is not to the right of the right MCP point or that the MCP point is below the PIP and DIP points.
To execute this program, just do:
$ ./bin/checkdb.py -v database annotations
Errors are printed to the screen indicating the problems found. Using a double
-v option (e.g. -vv) will also print the checked filenames as the
program advances.
Displaying the mean image
The program meanimg.py can display the mean image and annotations from an
existing annotated database, together with the total count of images available
for training a model:
$ ./bin/meanimg.py -vv database annotations
This should display an image like the following:
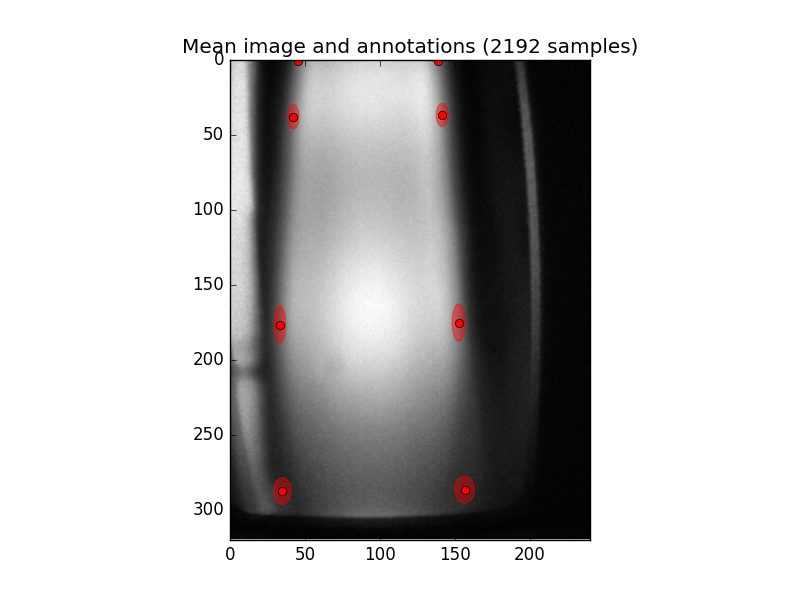
Fig. 1 Mean image of a fingervein image database showing the 8 annotation points (red dots) and the ellipses around it indicate the standard deviations on annotations.
Training
In order to train a new model for landmark detection, use the program
train.py:
$ ./bin/train.py -vv database annotations --model=model
This command will consider your image database is organized in database
with the respective 8-point annotations in annotations and will train a
model for finger fitting using all the data available. The model will be saved
as a Python pickle file in model.pkl.gz as indicated by the -m option.
You can use the flag --help to get a full help message in all programs
shipped in this package. The option -v, here repeated twice, makes the
program more verbose, allowing it to report its progress as it goes.
Note
Currently, programmed training routines will check if annotations for every image in your database exist, before considering to use an image for training the model. Because of this feature, it is OK to have less annotations than images on the original database.
Tip
For best performance, make sure both the database and annotations
directories and files are on your local disk. Network-based mounts may slow
down the training phase.
Using the SGE Grid for Training
This stage of the processing is probably the one with the most demanding amounts of memory. You can use the SGE grid to submit a job like this:
$ ./bin/jman submit --queue=q1dm --io-big -- ./bin/train.py -vv database annotations --model=model
It is recommended to use the flag --io-big to make sure the job is executed
in a setup which allows for a confortable bandwidth between the CPU and the
storage.
Landmarks for a single image
In order to extract landmark annotations from an new image, use the script
fit.py:
./bin/fit.py -vv database --model=model.pkl.gz --output=results
This command will find all PNG files available under the directory database
and will iteratively apply the model file model.pkl.gz in order to estimate
landmarks on each of the images therein. Landmark fitting results will be
placed in the output directory results, following the same directory
structure as for the original database. Results per image are stored as HDF5
files containing the final fitting results together with the intermediary and
initial values.
If you don’t specify the --output option and, instead, provide the
--show, the fitting program will just display (and not record) the fitting
results. This is useful for visualizing fitting results prior to database
processing. In particular, its possible to down-filter which images to display
by, instead of passing a database directory, passing multiple input images (at
least one must be passed though). For example:
$ ./bin/fit.py -vv database/image1.png --model=model.pkl.gz --show
This should display something like the following image:
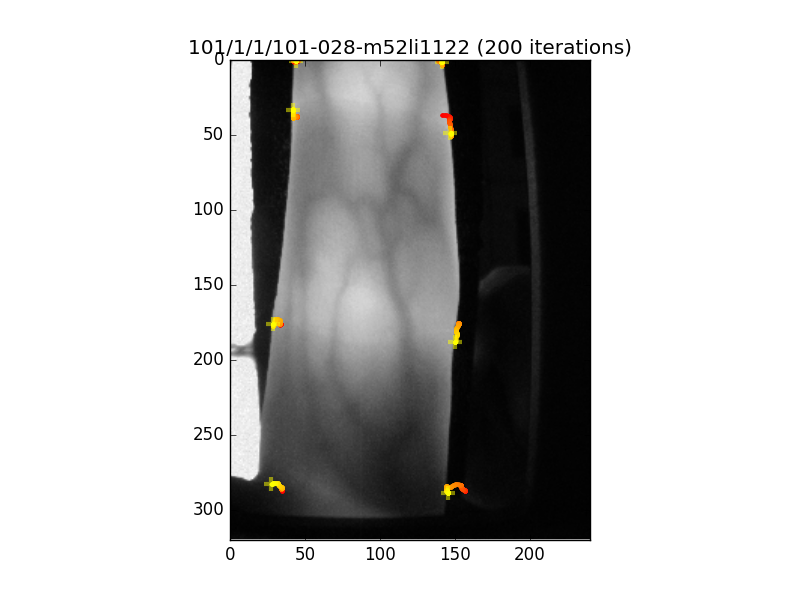
Fig. 2 Image showing the landmark detection results for the fingervein image displayed. The yellow crosses define the final resting point of the fitting procedure, while the coloured lines (starting from red), indicate the point trajectories as the fitter iterated. You can control the number of iterations to operate the fitter for.
Using the SGE Grid for Fitting Images
Because this stage of the processing is the most lengthy part of an evaluation
setup, we support distributing it over an SGE grid using Parallel Job Manager. In
order to execute the program fit.py in multiple, independent tasks, run
something like the following:
$ ./bin/jman submit --array=64 --queue=q1d --io-big -- ./bin/fit.py -vv database --model=model.pkl.gz --output=results
It is recommended to use the flag --io-big to make sure the jobs are
executed in a setup which allows for a confortable bandwidth between the CPU
and the storage.
Evaluation of databases
Finally, the program evaluate.py runs full database evaluations and outputs
merith figures for the considered dataset.
$ ./bin/evaluate.py -vv --save=analysis.pdf database annotations results
The evaluation script assumes results have been previously generated (and
saved) in a directory called results. Figures are produced in PDF format
and saved in the file named after the --save option. The best and worst
fits are printed on the screen.