Cross-Database (X-)Tests
F1 Scores (micro-level)
Models are trained and tested on the same dataset (numbers in parenthesis indicate number of parameters per model), and then evaluated across the test sets of other databases. X-tested datasets therefore represent unseen data and can be a good proxy for generalisation analysis.
Each table row indicates a base trained model and each column the databases the model was tested against. The native performance (intra-database) is marked in bold. Thresholds are chosen a priori on the training set of the database used to generate the model being cross-tested. Hence, the threshold used for all experiments in a same row is always the same.
You can cross check the analysis numbers provided in this table by downloading this software package, the raw data, and running
bob binseg
analyze
providing the model URL as--weightparameter, and then the-xtestresource variant of the dataset the model was trained on. For example, to run cross-evaluation tests for the DRIVE dataset, use the configuration resourcedrive-xtest.We only show results for DRIU (~15.4 million parameters) and M2U-Net (~550 thousand parameters) as these models seem to represent the performance extremes according to our baseline analysis. You may run analysis on the other models by downloading them from our website (via the
--weightparameter on the analyze script). This script may help you in this task, provided you created a directory structure as suggested by our baseline script:#!/usr/bin/env bash # Runs cross database tests BOB=$HOME/work/bob/bob.ip.binseg/bin/bob for d in drive stare chasedb1 iostar-vessel hrf; do for m in driu hed m2unet unet; do cmd=(${BOB} binseg analyze -vv ${m} "${d}-xtest") cmd+=("--weight=${m}/${d}/model/model_lowest_valid_loss.pth") cmd+=("--output-folder=${m}/${d}/xtest") "${cmd[@]}" done done
DRIU
drive |
stare |
chasedb1 |
hrf |
iostar-vessel |
|
|---|---|---|---|---|---|
Model / W x H |
544 x 544 |
704 x 608 |
960 x 960 |
1648 x 1168 |
1024 x 1024 |
0.819 (0.016) |
0.759 (0.151) |
0.321 (0.068) |
0.711 (0.067) |
0.493 (0.049) |
|
0.733 (0.037) |
0.824 (0.037) |
0.491 (0.094) |
0.773 (0.051) |
0.469 (0.055) |
|
0.730 (0.023) |
0.730 (0.101) |
0.811 (0.018) |
0.779 (0.043) |
0.774 (0.019) |
|
0.702 (0.038) |
0.641 (0.160) |
0.600 (0.072) |
0.802 (0.039) |
0.546 (0.078) |
|
0.758 (0.019) |
0.724 (0.115) |
0.777 (0.032) |
0.727 (0.059) |
0.825 (0.021) |
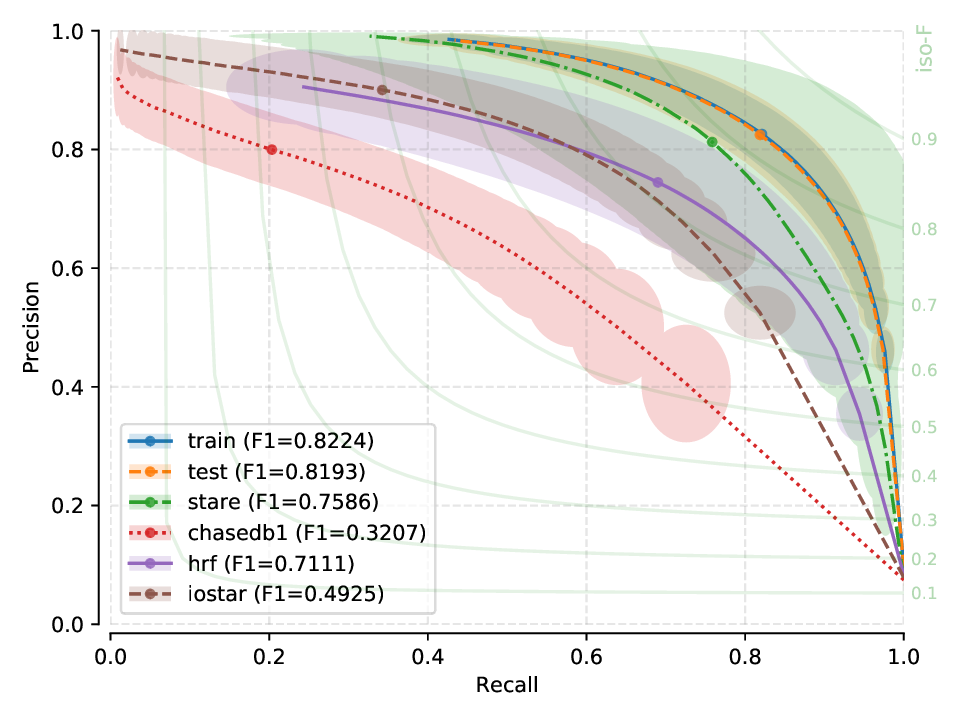
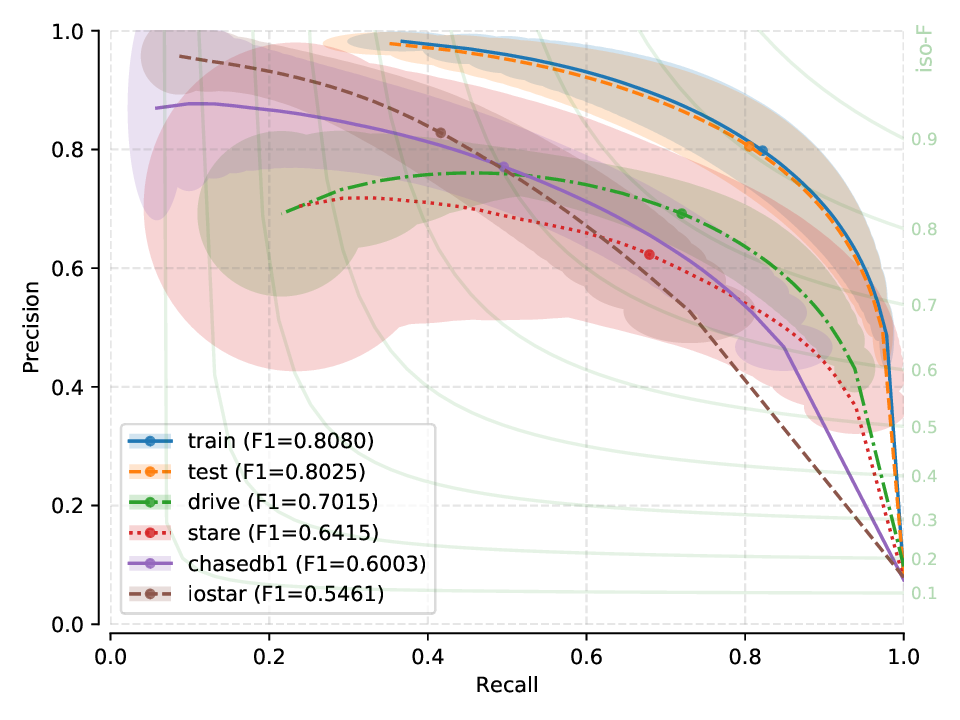
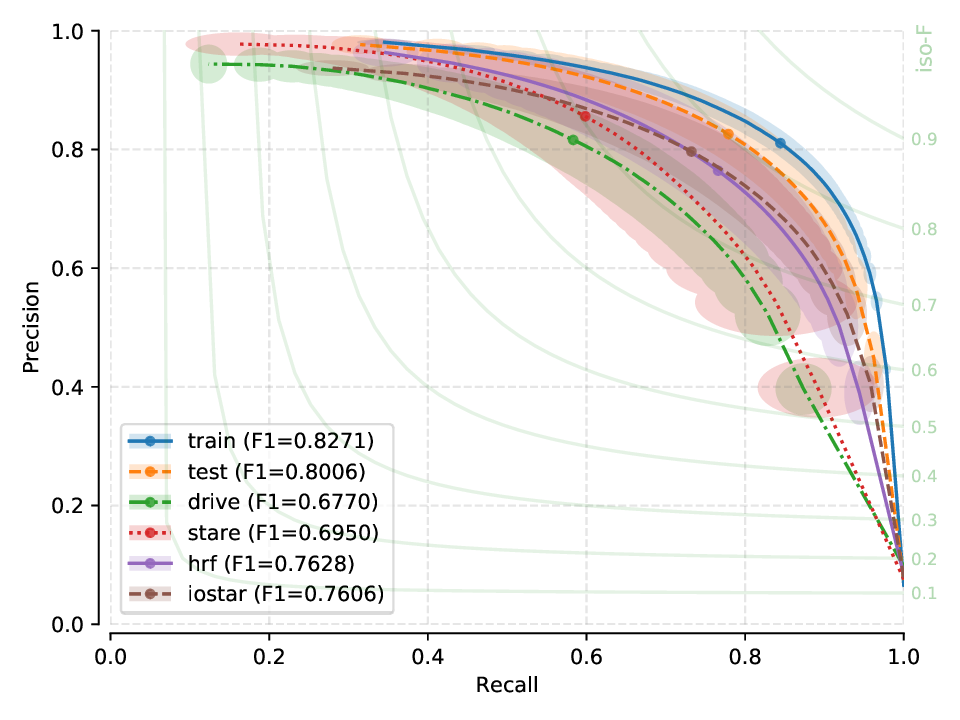
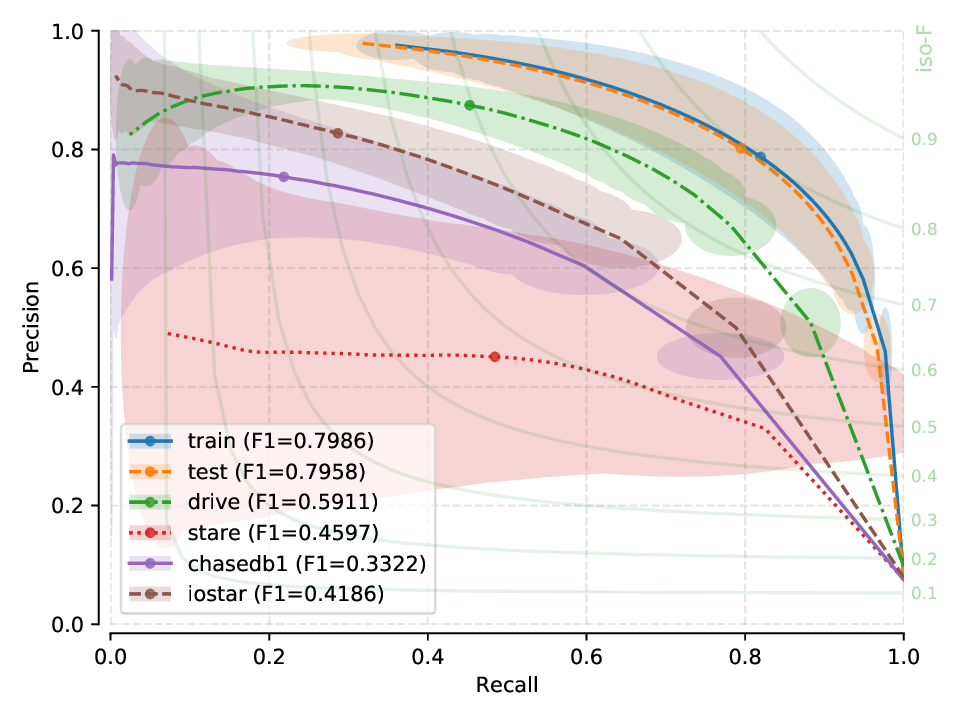
Next, you will find the PR plots showing confidence intervals, for the various cross-tests explored, on a per cross-tested model arrangement. All curves correspond to test set performances. Single performance figures (F1-micro scores) correspond to its average value across all test set images, for a fixed threshold set a priori on the training set of dataset used for creating the model, and using 100 points for curve calculation.
Fig. 12 |
M2U-Net
drive |
stare |
chasedb1 |
hrf |
iostar-vessel |
|
|---|---|---|---|---|---|
Model / W x H |
544 x 544 |
704 x 608 |
960 x 960 |
1648 x 1168 |
1024 x 1024 |
0.804 (0.014) |
0.736 (0.144) |
0.548 (0.055) |
0.744 (0.058) |
0.722 (0.036) |
|
0.715 (0.031) |
0.811 (0.039) |
0.632 (0.033) |
0.765 (0.049) |
0.673 (0.033) |
|
0.677 (0.027) |
0.695 (0.099) |
0.801 (0.018) |
0.763 (0.040) |
0.761 (0.018) |
|
0.591 (0.071) |
0.460 (0.230) |
0.332 (0.108) |
0.796 (0.043) |
0.419 (0.088) |
|
0.743 (0.019) |
0.745 (0.076) |
0.771 (0.030) |
0.749 (0.052) |
0.817 (0.021) |
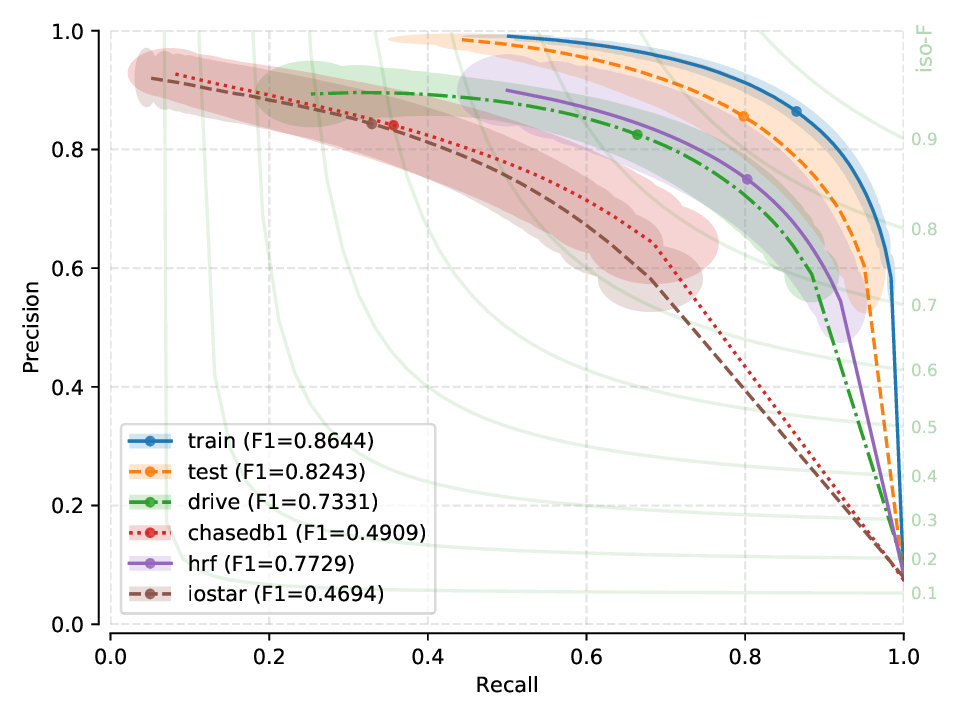
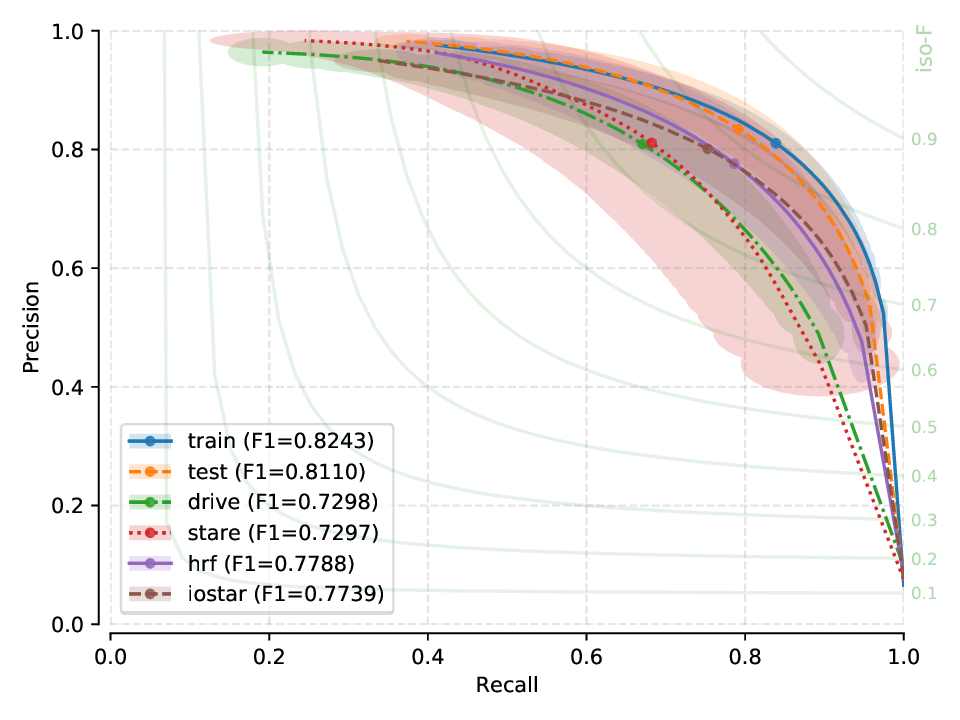
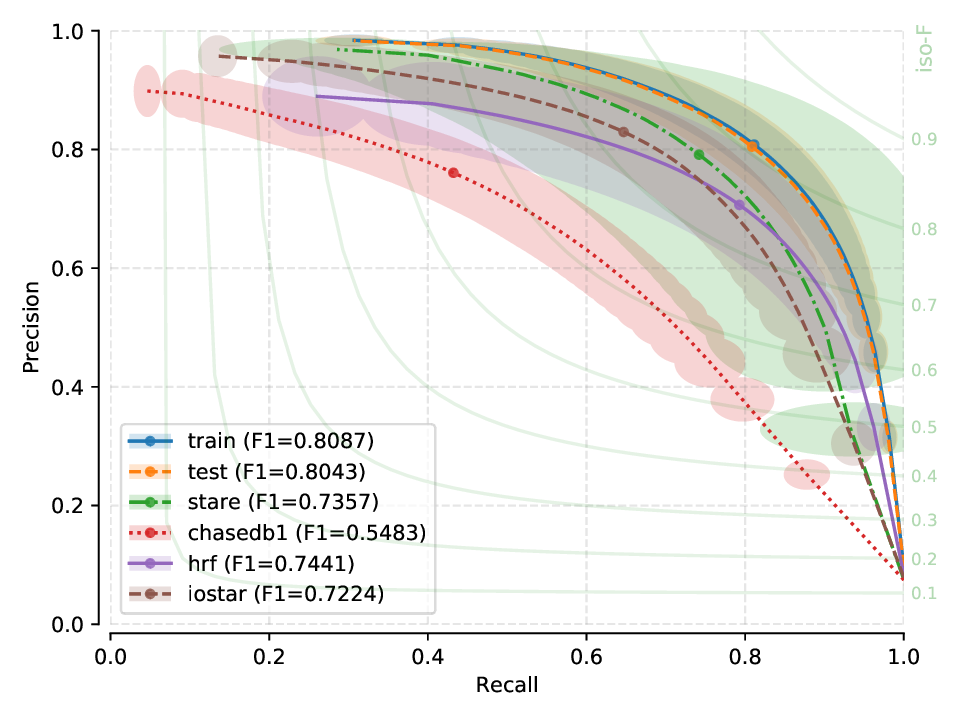
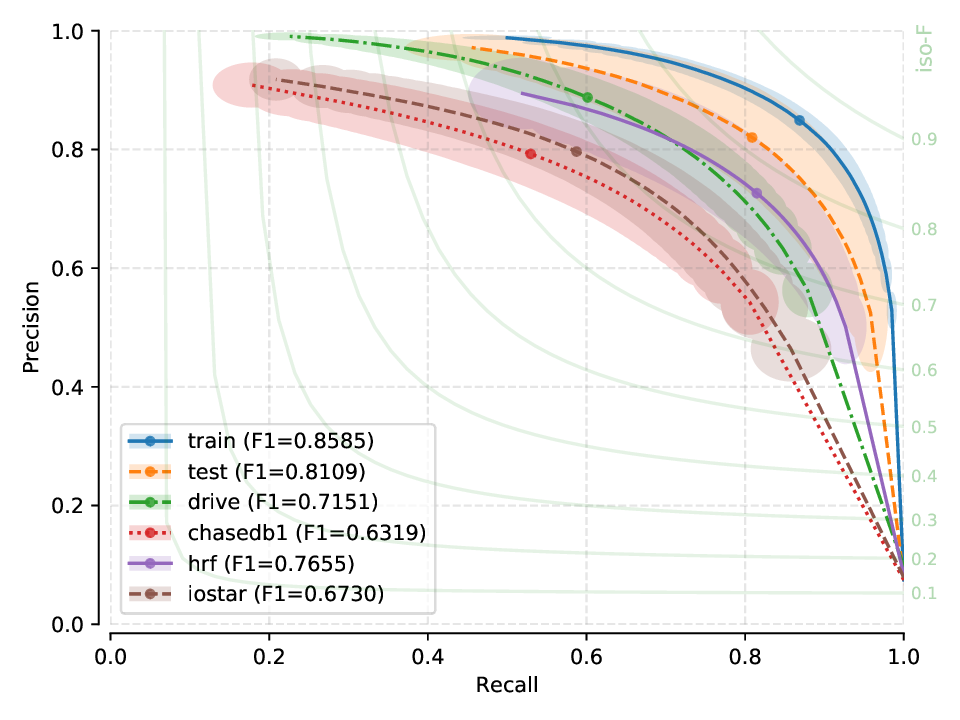
Next, you will find the PR plots showing confidence intervals, for the various cross-tests explored, on a per cross-tested model arrangement. All curves correspond to test set performances. Single performance figures (F1-micro scores) correspond to its average value across all test set images, for a fixed threshold set a priori on the training set of dataset used for creating the model.
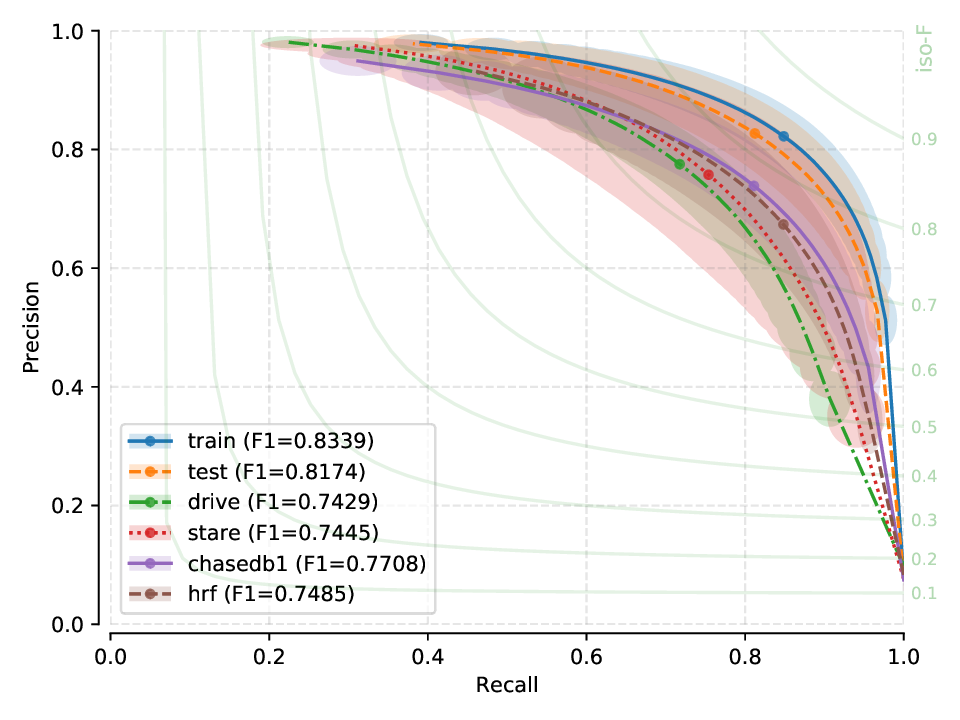
Fig. 17 |
Remarks
For each row, the peak performance is always obtained in an intra-database test (training and testing on the same database). Conversely, we observe a performance degradation (albeit not catastrophic in most cases) for all other datasets in the cross test.
X-test performance on a model created from HRF suggests a strong bias, as performance does not generalize well for other (unseen) datasets.
Models generated from CHASE-DB1 and IOSTAR (vessel) seem to generalize quite well to unseen data, when compared to the relatively poor generalization capabilites of models generated from HRF or DRIVE.