Todo
This section is outdated and needs re-factoring.
COVD- and COVD-SLL Results
In addition to the M2U-Net architecture, we also evaluated the larger DRIU network and a variation of it that contains batch normalization (DRIU+BN) on COVD- (Combined Vessel Dataset from all training data minus target test set) and COVD-SSL (COVD- and Semi-Supervised Learning). Perhaps surprisingly, for the majority of combinations, the performance of the DRIU variants are roughly equal or worse to the ones obtained with the much smaller M2U-Net. We anticipate that one reason for this could be overparameterization of large VGG-16 models that are pretrained on ImageNet.
F1 Scores
Comparison of F1 Scores (micro-level and standard deviation) of DRIU and M2U-Net on COVD- and COVD-SSL. Standard deviation across test-images in brackets.
F1 score |
|||
|---|---|---|---|
0.788 (0.018) |
0.797 (0.019) |
||
0.785 (0.018) |
0.783 (0.019) |
||
0.778 (0.117) |
0.778 (0.122) |
||
0.788 (0.102) |
0.811 (0.074) |
||
0.796 (0.027) |
0.791 (0.025) |
||
0.796 (0.024) |
0.798 (0.025) |
||
0.799 (0.044) |
0.800 (0.045) |
||
0.799 (0.044) |
0.784 (0.048) |
||
0.791 (0.021) |
0.777 (0.032) |
||
0.797 (0.017) |
0.811 (0.074) |
M2U-Net Precision vs. Recall Curves
Precision vs. recall curves for each evaluated dataset. Note that here the F1-score is calculated on a macro level (see paper for more details).
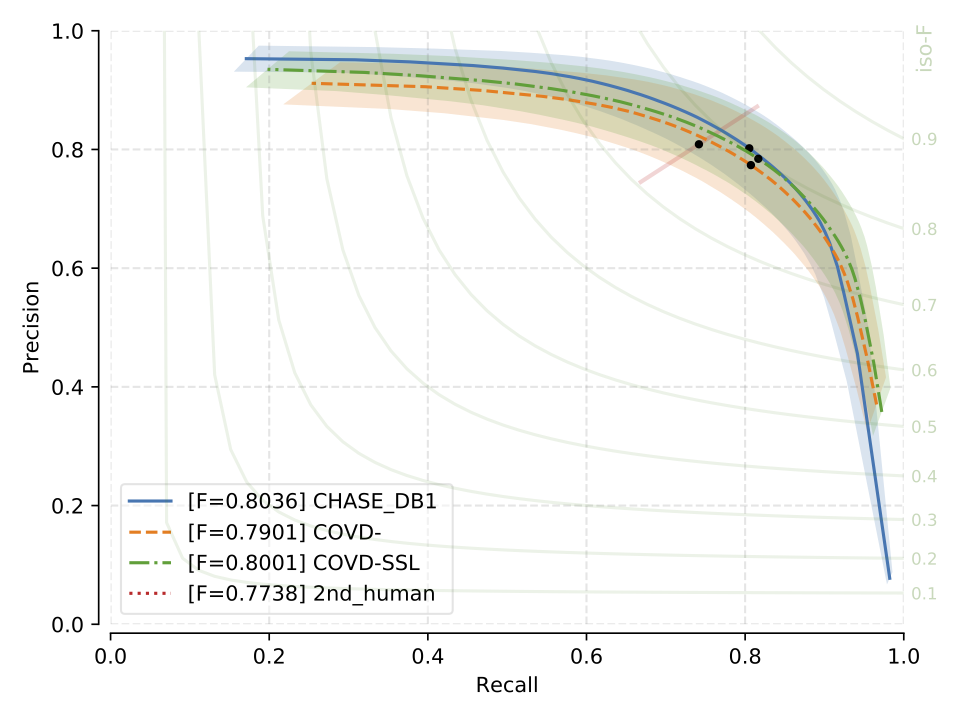
Fig. 18 CHASE_DB1: Precision vs Recall curve and F1 scores
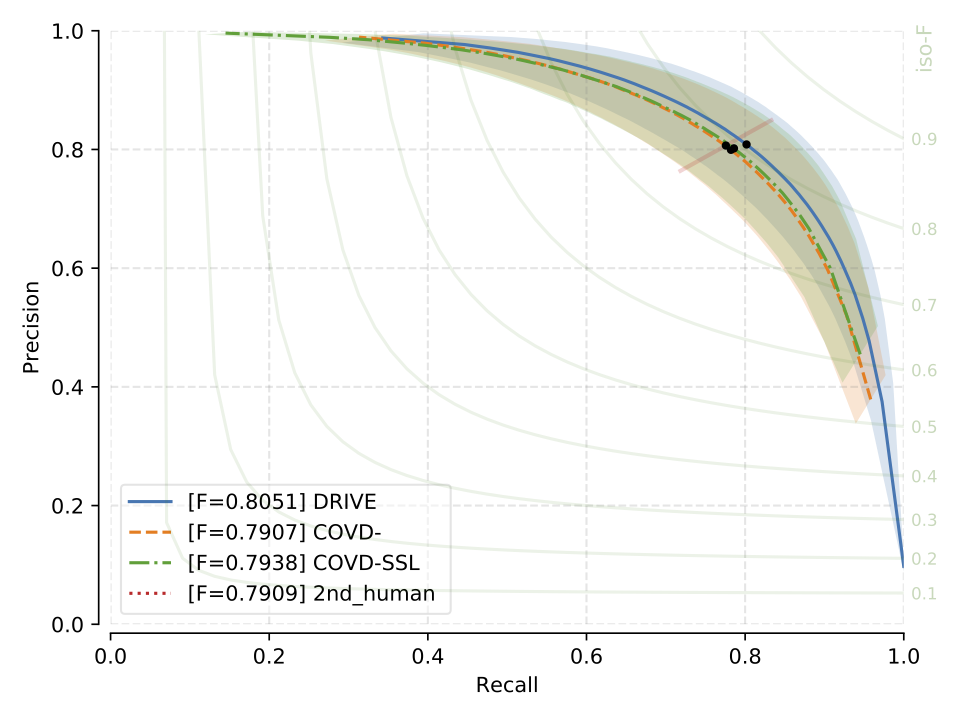
Fig. 19 DRIVE: Precision vs Recall curve and F1 scores
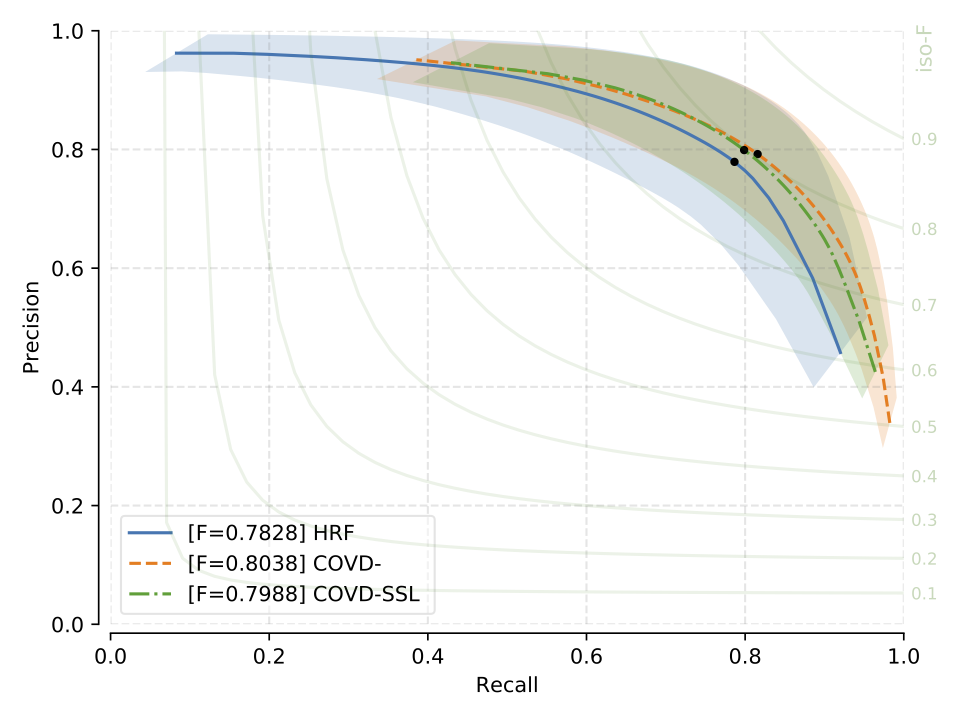
Fig. 20 HRF: Precision vs Recall curve and F1 scores
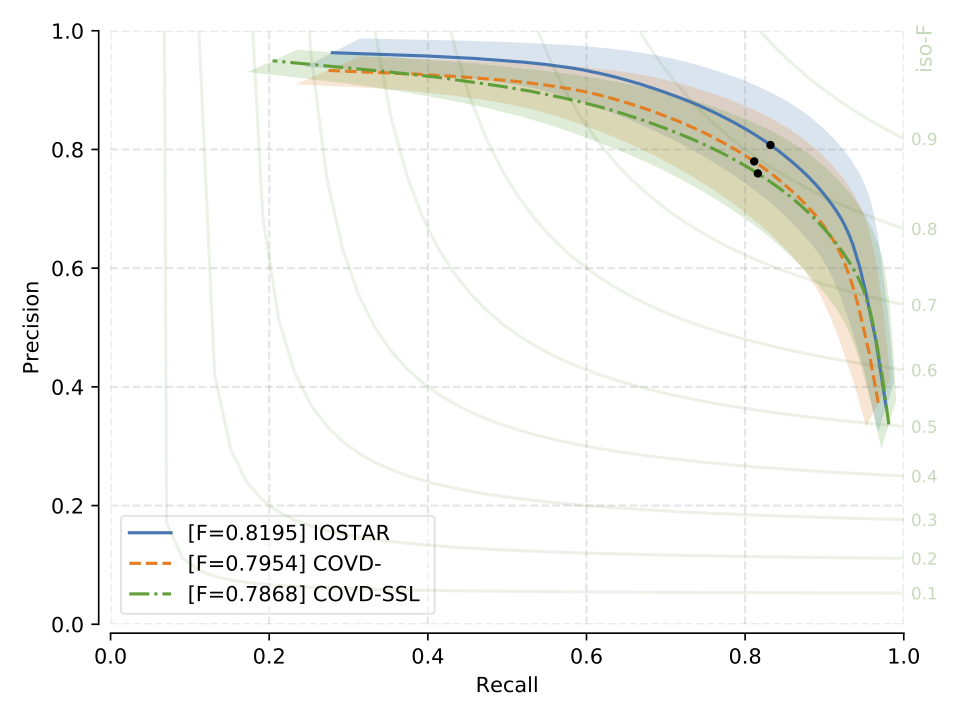
Fig. 21 IOSTAR: Precision vs Recall curve and F1 scores
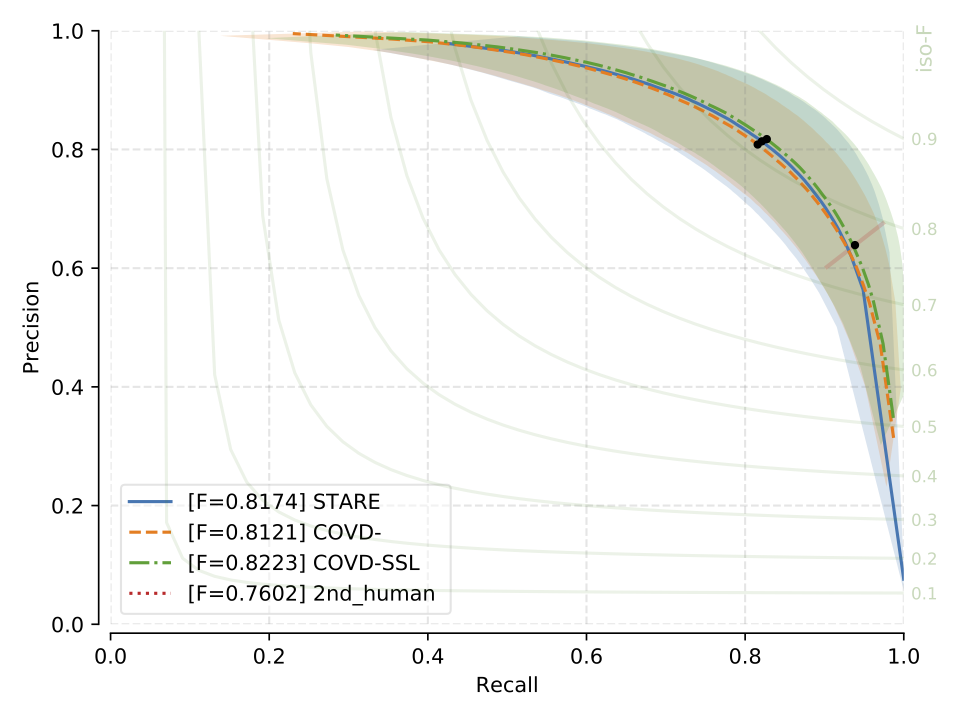
Fig. 22 STARE: Precision vs Recall curve and F1 scores