Baseline Results
F1 Scores (micro-level)
Benchmark results for models: DRIU, HED, M2U-Net, U-Net, and Little W-Net.
Models are trained and tested on the same dataset (numbers in bold indicate approximate number of parameters per model). DRIU, HED, M2U-Net and U-Net Models are trained for a fixed number of 1000 epochs, with a learning rate of 0.001 until epoch 900 and then 0.0001 until the end of the training, after being initialized with a VGG-16 backend. Little W-Net models are trained using a cosine anneling strategy (see [GALDRAN-2020] and [SMITH-2017]) for 2000 epochs.
During the training session, an unaugmented copy of the training set is used as validation set. We keep checkpoints for the best performing networks based on such validation set. The best performing network during training is used for evaluation.
Image masks are used during the evaluation, errors are only assessed within the masked region.
Database and model resource configuration links (table top row and left column) are linked to the originating configuration files used to obtain these results.
Check our paper for details on the calculation of the F1 Score and standard deviations (in parentheses).
Single performance numbers correspond to a priori performance indicators, where the threshold is previously selected on the training set
You can cross check the analysis numbers provided in this table by downloading this software package, the raw data, and running
bob binseg
analyze
providing the model URL as--weightparameter.For comparison purposes, we provide “second-annotator” performances on the same test set, where available.
Our baseline script was used to generate the results displayed here.
HRF models were trained using half the full resolution (1168x1648)
lwnet? |
||||||
|---|---|---|---|---|---|---|
Dataset |
2nd. Annot. |
15M |
14.7M |
550k |
25.8M |
68k |
0.788 (0.021) |
||||||
0.759 (0.028) |
||||||
0.768 (0.023) |
||||||
|
||||||
|
||||||
Precision-Recall (PR) Curves
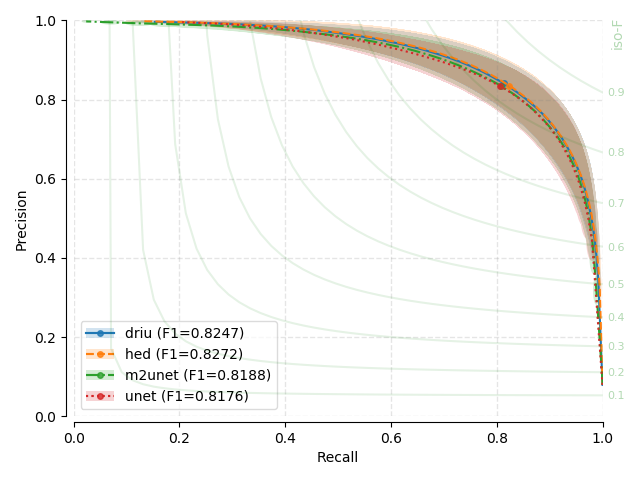
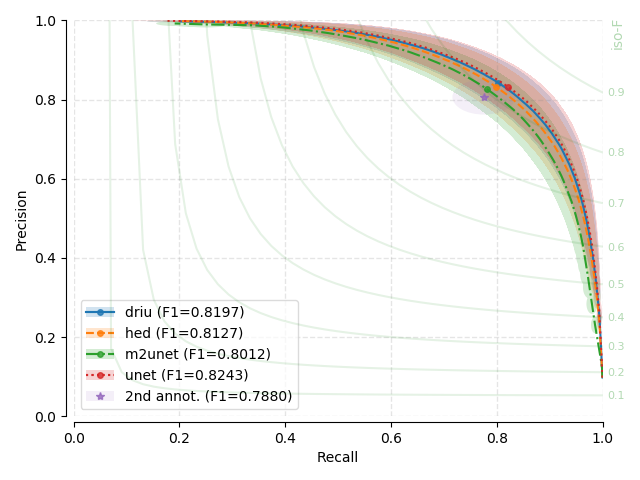
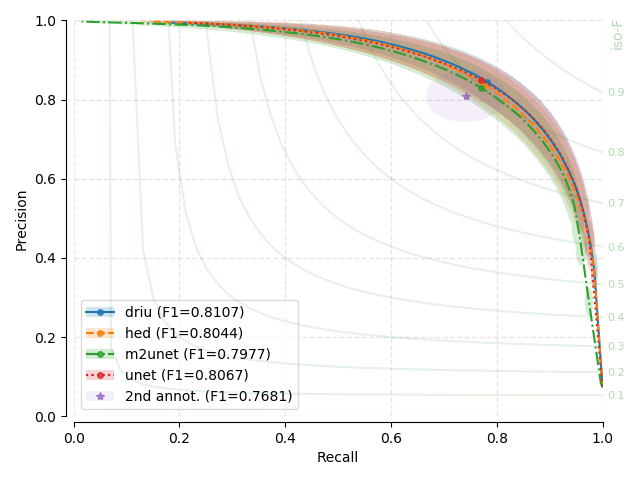
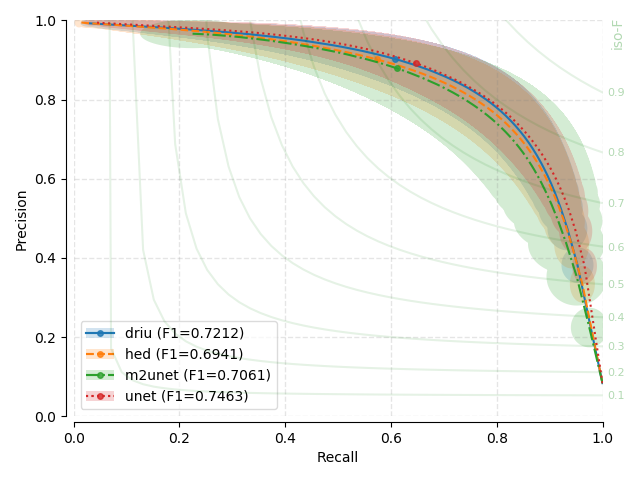
Next, you will find the PR plots showing confidence intervals, for the various
models explored, on a per dataset arrangement. All curves correspond to test
set performances. Single performance figures (F1-micro scores) correspond to
its average value across all test set images, for a fixed threshold set to
0.5, and using 1000 points for curve calculation.
Tip
Curve Intepretation
PR curves behave differently than traditional ROC curves (using Specificity versus Sensitivity) with respect to the overall shape. You may have a look at [DAVIS-2006] for details on the relationship between PR and ROC curves. For example, PR curves are not guaranteed to be monotonically increasing or decreasing with the scanned thresholds.
Each evaluated threshold in a combination of trained models and datasets is represented by a point in each curve. Points are linearly interpolated to created a line. For each evaluated threshold and every trained model and dataset, we assume that the standard deviation on both precision and recall estimation represent good proxies for the uncertainty around that point. We therefore plot a transparent ellipse centered around each evaluated point in which the width corresponds to twice the recall standard deviation and the height, twice the precision standard deviation.

Fig. 6 |
Remarks
There seems to be no clear winner as confidence intervals based on the standard deviation overlap substantially between the different models, and across different datasets.
There seems to be almost no effect on the number of parameters on performance. U-Net, the largest model, is not a clear winner through all baseline benchmarks
Where second annotator labels exist, model performance and variability seems on par with such annotations. One possible exception is for CHASE-DB1, where models show consistently less variability than the second annotator. Unfortunately, this is not conclusive.
Training at half resolution for HRF shows a small loss in performance (10 to 15%) when the high-resolution version is used as evaluation set.


